Three in four people who fill a cart never finish.

Your products sell themselves. One in ten visitors adds something to a cart, which puts KAXI in the top tenth of all online stores. The trouble starts after that.

What we looked at90 days of your Shopify data
Visits reviewed243,188
Live ads read88
DatedJuly 2026

What it's worth

Four leaks. Each one measurable, each one sitting in data you already own.

What we found
$32K
a month, on careful numbers
Which is
$7,400
a week
Visitors who buy
2.32%
of 243,188 people
Lost after choosing
18,469
people who meant to buy
What working together adds each month
$32K $24K $16K $8K +$9K +$19K +$32K Today Day 30 Day 60 Day 90
Days 1 to 30

Fix what's broken. These are faults, not opinions. They don't need testing, they need repairing.

Days 31 to 60

Go after the cart. The biggest leak, worked on with recordings of real visits rather than guesswork.

Days 61 to 90

Make each visit worth more. Better landing pages for your best ads, and more value per order.

How we worked these numbers out
  • Your own Shopify exports. No industry averages borrowed from other brands.
  • Visitors affected × the gap in performance × $62 an order. Your real average is $66, so these are floors.
  • The four add to $42,100. Some is the same money twice over, so we cut a quarter and call it $32,000.
  • The full working for each one sits in its own finding in section 04.

Who's shopping, and on what

One piece of background that shapes every finding that follows.

Background

Almost everyone is on a phone

This is why every recommendation in this report is written for mobile first.

82.6% ON PHONES Phone 200,679 visits Desktop 41,789 visits
The awkward part Desktop is only 17% of your traffic. It is doing so poorly that closing the gap on its own is worth about $12,100 a month.

The nine things we found

Ordered by what they're worth, not by how easy they are to talk about.

High priority

01. Half your carts never reach the checkout page

Worth
$14,100
a month, or $3,300 a week

Someone tapped "add to cart". They picked a colour. They wanted it. Then half of them never even saw your checkout page.

The drop, in people
Added to cart 24,120 Reached checkout 11,840 12,280 people gone at this step Shopify conversion report, 18 April to 17 July 2026
Why this one comes first
  • These are the warmest buyers you will ever have. They already chose a product.
  • It affects every product, every campaign and every channel at the same time.
  • A healthy store gets 55 to 65 out of every 100 carts into checkout. You get 49.
  • You already paid the advertising cost for every one of these people.
What we can't tell you yet, and won't pretend to Your Shopify exports show us how many people dropped out. They don't show what was in the cart when it happened. We have a good idea why (see section 05) and one report from you would settle it in an afternoon.
How we got to this number$14,100 a month
1Shoppers who put something in a cartShopify, conversion breakdown, 18 Apr to 17 Jul24,120
2Of those, the number who got as far as the checkout page. So half of them walk away first11,840 out of 24,120 is 49 in every 10011,840
3A normal store gets 55 to 65 in every 100 this far. Use 55, the worst end of normal, and 13,266 would have reached checkout instead of 11,84024,120 × 55% = 13,266. Benchmark: Baymard Institute and Littledata+1,426 shoppers
4Not everyone at checkout pays. On your site about 48 in every 100 do, so that is how many of the extra 1,426 turn into real orders1,426 × 48% = 681+681 orders
=681 orders × $62 = $42,200 over the 90 days, which isWe used $62 an order. Your real average was closer to $66$14,100 a month
High priority

02. Desktop sells at less than half the rate of phones

Worth
$12,100
a month, or $2,800 a week

In almost every online store, desktop does better than mobile. Yours runs the other way round.

DeviceVisitsAdd to cartBuyReading
Phone200,67911.0%2.57%Healthy
Desktop41,7894.8%1.16%Something's wrong
The detail that gives it away Desktop visitors aren't giving up at the checkout. They're failing to add anything to a cart in the first place, at 4.8% against 11.0% on phones. That pattern points to a fault on the page rather than a change of heart.

Our honest read: this is the most likely quick win in the whole report. Faults get repaired, they don't need months of testing. We would want to watch it happen in real recordings before promising a cause.

How we got to this number$12,100 a month
1Visits from people on a computer rather than a phoneShopify, sessions by device41,789
2Of those, the number who bought something. That is about 1 in every 100485 out of 41,789 is 1.16 in every 100485 orders
3On phones, 2.57 in every 100 buy. Same store, same products, same prices, so computers should not be less than half as goodShopify, sessions by device2.57%
4If computer visitors bought at the phone rate, you would have had 1,073 orders instead of 48541,789 × 2.57% = 1,073+588 orders
=588 orders × $62 = $36,400 over the 90 days, which isWe used $62 an order. Your real average was closer to $66$12,100 a month
High priority

03. 40,000 ad clicks land on your weakest pages

Worth
$6,800
a month, or $1,600 a week

We pulled all 88 of your live ads and followed where every one of them sends people. Your three biggest campaigns sell at about half the rate of the rest of the site.

One of your ads, followed from start to finish
KAXI advert headlined the all-day hold claw clip
Your ad, live since 28 May"finally a claw clip that survives a 12 hour shift. no headaches, no constant readjusting."
›
shopkaxi.com/collections/hold-everything-claws
1.56%
of the people who land here buy something. It is a general category page. Nothing on it mentions shifts, nurses, or long days on your feet.
The part worth sitting with That ad is written for people who work twelve hour shifts. You sell a Nurse claw. Its page sells at 4.36%, the best of any busy page on your site. The ad doesn't send anyone there.
How each campaign compares to your site average of 2.32%
Site average 2.32% Campaign ending 390051 0.70% 11,450 clicks Campaign ending 900051 1.07% 14,007 clicks Campaign ending 240051 1.52% 14,145 clicks
Some of the links your ads point at
ad goes to /products/color-changing-claws?_pos=1&_sid=7a6ded01f&_ss=r this is a search results link, used as an ad destination ad goes to /wavy-hold-everything-claw-bundle?fbclid=fbclid a placeholder nobody replaced ad goes to http://shopkaxi.com/ not secure, so it redirects before the page opens ad goes to /collections/polka-dot-collection?page=1 page two of a list, rather than a page built to sell
Taken from your live Meta ad library on 18 July 2026, all 88 ads read
The bigger issue underneath
  • You have no pages built for ads. Every ad drops people onto a general product or category page.
  • About half your ads are automatic product ads that send people to unsorted category pages.
  • The same product is advertised under two different links, which splits your reporting and hides what actually works.
Worth saying plainly Your ads are not the problem. They are good enough that people click and add to cart at a top ten percent rate. The problem is where they land.
How we got to this number$6,800 a month
1Visits from your three biggest paid campaigns, all of it traffic you paid forShopify, sessions by UTM campaign39,602
2Of those, the number who bought something. About 1 in every 100461 out of 39,602 is 1.16 in every 100461 orders
3Your site as a whole gets 2.32 in every 100. We used 2, below your own average, so this stays conservativePaid traffic should do better than average, not worse2.0%
4At 2 in every 100, those same paid visits give 792 orders instead of 46139,602 × 2% = 792+331 orders
=331 orders × $62 = $20,500 over the 90 days, which isWe used $62 an order. Your real average was closer to $66$6,800 a month
Medium priority

04. Nothing prompts people to add more items to the cart

Worth
$9,100
a month, or $2,100 a week

Your customers already buy six to eight items at once. That is a lot of willingness. Once they have decided, nothing is set up to make the most of it.

Average order value by month
$80 $70 $60 $65 $60 $66 $76 $61 $60 FebMarApr MayJunJul May had a bundle offer running. 13.1 items an order.
What May tells us
  • In May the average order reached $75.76 and 13.1 items, with a bundle offer running.
  • When the offer stopped, order value dropped back to $60.
  • Your customers respond to the right offer at the right moment. You have already proved it.
  • Right now that lever gets pulled by hand, now and then, instead of running quietly all the time.
The gap in one line 5,651 customers a quarter reach the moment they are most willing to spend, and nothing is there to meet them.
How we got to this number$9,100 a month
1Orders in the 90 days, so about 1,884 a monthShopify, conversion breakdown5,651
2At $62 an order, that is roughly this much in sales every month1,884 × $62 = $116,800. We used $62. Your real average was closer to $66$116,800 a month
3In May a bundle offer lifted your average order to $75.76. That is 21% more per order, and it already happened onceShopify, average order value by month, Feb to Jul+21%
4We did not assume you keep all of that. We assumed you keep about a third of it as a permanent liftA third of 21% is roughly 7.8%7.8%
=7.8% of $116,800 a month, which is$9,100 a month
Medium priority

05. A page you're paying to promote sells at 0.65%

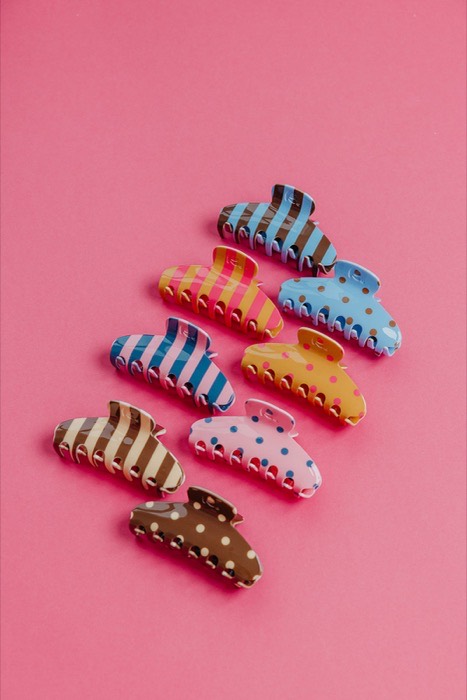
The Polka Dot and Striped Oversized Claws page took 3,973 visits. It is one of your ten busiest entry pages and your stripes and polka dots campaign drives people straight to it. It sells at a quarter of the rate of your other claw pages.

Page people land onVisitsVisitors who buy
Motherhood Claw5,1192.52%
Matte Original Hold Everything Claw4,6872.22%
Wavy Original Hold Everything Claw4,6631.80%
Polka Dot and Striped Oversized Claws3,9730.65%
KAXI polka dot and striped oversized claws
The product3,973 visits
0.65%
of visitors buy, against 2.52% on your Motherhood Claw page
The product is good. The traffic is real and paid for. Something between the click and the checkout is going wrong here specifically.
What we saw when we opened it on a phone We went to the exact page your ads point at and looked at it the way a customer would. In the first screenful of products, items marked sold out were sitting above items that were in stock and on sale. You are paying for clicks that land on things nobody can buy.
Seen on shopkaxi.com/collections/polka-dot-collection, on a phone, 18 July 2026
Medium priority

06. Your search box can't find your own products

People who use your search buy at 3.3%, well above your site average of 2.32%. They are your most motivated visitors. Your search is letting them down.

"cool mom" 135 searches, no results you sell Cool Mom claws, hats and scrunchies "gone fishing" 13 searches, no results the product is spelled "GONE FISHIN'" "nurse clip" 4 searches, no results the Nurse claw exists "bride" 11 searches, no results you sell a Bride 3D claw
Shopify report on searches with no results, last 90 days
There's a product list hiding in this data Customers are typing doctor, dental, social worker, psychologist, phlebotomist, CNA and RDH. They are asking for occupation claws you haven't made yet, in their own words, for free.
Medium priority

07. Your best converting page is sold out with no way to be told when it's back

"Nurse" is the second most searched word on your whole site, with 817 searches. The Nurse claw page sells at 4.36%, the best of any busy product page you have.
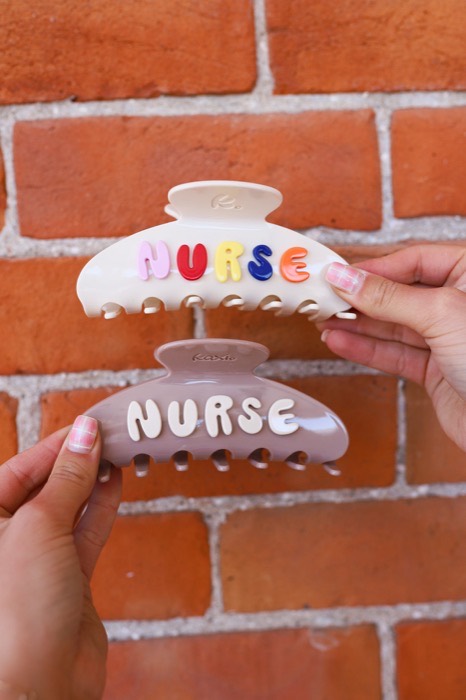
KAXI Nurse 3D acetate claw
4.36%
of visitors buy, against 2.32% site wide
Sold out
VISITORS WHO BUY Nurse claw 4.36% Site average 2.32% Currently sold out, with no way to be told when it returns.
And in your own email figures Your back in stock emails sell at 14.6%, one of the best things you do. Demand is arriving, meeting a sold out page, and leaving with no way to bring it back.
Low priority

08. Your review count undercuts your own trust claim

KAXI color changing claws advert
Your longest running ad. Live without a break since July 2025, which makes it the closest thing you have to a proven winner.

On the product page that ad points at, these two lines sit next to each other:

4.2 stars, 16 reviews Loved and Trusted by 20,000+ customers
Seen on a phone at shopkaxi.com, 18 July 2026
  • 16 reviews next to 20,000 customers reads as a contradiction to a first time visitor.
  • Two banners at the top repeat the same free shipping message, using about 15% of the first screen on a phone.
  • Reviews are the cheapest trust you can build, and you have 5,651 buyers a quarter to ask.
Low priority

09. A returns add-on is your fifth best seller

"Free Unlimited Return + Package Protection" appears in your product reports with 3,824 units sold, above the Scalloped Claw, the Lay Down Claw and everything else.

4th KAXI WAVY ORIGINAL HOLD EVERYTHING CLAW 4,332 5th Free Unlimited Return + Package Protection 3,824 6th KAXI SCALLOPED ORIGINAL HOLD EVERYTHING 3,713
Shopify units sold by product, last 90 days
  • It turns up inside category pages and search results as though it were a product.
  • It skews every best seller list and report you look at.
  • It is also a suspect in the cart problem, since it adds a line people meet at the worst possible moment.

The one thing we can't answer yet

This may be the most valuable page in the report. It is also the only thing in it we have left unanswered, because answering it properly needs a report only you can pull.

What we think is happening
Most of your abandoned carts are sitting just under $60, and they stop at the moment the shipping cost appears.

You offer free US shipping over $60. A single claw is around $14. So a lot of shoppers arrive at the checkout with a cart that doesn't qualify, and the first thing that happens is a delivery charge gets added to it.

What points us this way
CART VALUE $60 free shipping line One claw, $14 pays for delivery Typical month, $60 right on the line Completed orders gather just above the line. The gap below it is where carts die.
Why this is a clue rather than proof In March, June and July your average order landed between $59.75 and $61.36, right on the free shipping line. When completed orders cluster that tightly around a threshold, the threshold is usually shaping behaviour. People top up to clear it. The ones who don't top up are the ones we cannot see yet.
Where it would show up
  • Half of carts never reach checkout. If the delivery cost shows in the cart, the decision happens here.
  • Half of checkouts don't finish. If it shows at step one or two instead, the decision happens there.
  • Both numbers are unusually poor at once, which is what a single cost surprise tends to look like.
The most expensive unknown you have Between these two steps you lose 18,469 people a quarter who had already decided to buy. If even a third of that is down to the $60 line, it is the largest recoverable sum in this document.

The first 90 days

Repair what's broken. Settle the big question. Then make each visit and each ad dollar work harder.

Days 1 to 30

Stop the losses

Faults, not opinions. These need repairing, not testing.

  • Find and fix whatever is stopping desktop visitors adding to cart High
  • Stop ads landing on sold out and broken pages
  • Make the search box find your own products
  • Clear the returns add-on out of your catalogue
  • Put proper visit recording in place, so the next two months run on evidence
By day 30 About $9,000 a month recovered, and roughly $2,100 a week that stops going missing.
Days 31 to 60

Go after the cart

Now with real recordings and the abandoned cart figures in hand.

  • Settle the question about carts under $60 High
  • Rebuild the path from cart to checkout around what the data shows
  • Deal with the cost surprise, wherever it turns out to sit
  • Start running proper tests, so every change is measured rather than assumed
By day 60 About $19,000 a month, counting what's already been recovered.
Days 61 to 90

Make each visit worth more

With the leaks closed, the same traffic starts earning more.

  • Pages built properly for your best performing ads
  • Turn the May bundle result into something that runs all the time Medium
  • Capture the demand for sold out products instead of losing it
  • Build the review count your trust claims deserve Low
By day 90 About $32,000 a month, which is roughly $384,000 over a year.
How we work We don't change things on a hunch. Every fix is measured against the version it replaced, so at the end of 90 days you will know which changes earned which money. The ones that win keep winning long after we've gone.

What happens next

Everything above came out of data you already have. Here is the short list of what would let us go further.

What we'd need from you
  • Your abandoned checkouts export, with cart totals. This settles the $60 question straight away.
  • Permission to add a free recording tool. It takes minutes to set up and about a week to gather enough to read.
  • View access to your Meta ads account, so we can put real spend against the campaign findings.
  • View access to Google Analytics, to see which checkout step loses people.
None of this needs developer time. All of it is read only.
What we'd cover when we meet
  • Walk through the desktop problem live, on screen
  • Show you the ads and the pages they point at, side by side
  • Agree which two things we go after first
  • Scope, timing and what working together looks like
Worth repeating We haven't touched your traffic, your product or your brand anywhere in this report. Every dollar in it comes from people already arriving and already wanting to buy.
The short version

You don't have a traffic problem. You have a leak.

Nearly one in ten of your visitors already tries to buy something. The work is to stop losing them between the cart and the confirmation page.

A leak doesn't get worse suddenly. It just never stops.

If any of this is new

The two words this report leans on, in plain English.

Conversion
The share of visitors who buy something. Right now 2.32 out of every 100 people who visit KAXI place an order. Almost 98 in every 100 leave.
Conversion work
The job of raising that number without buying more visitors. You already paid to get every one of those 243,188 people. This is about keeping more of them.

The usual way to grow

Spend more on ads. Get more visitors. Get more sales.

  • The cost goes up every month
  • You bid against everyone else for the same space
  • Growth stops the day you stop paying

The other way

Find out why people leave. Stop it happening.

  • These visitors are already paid for
  • A fix keeps paying every month after you make it
  • It makes the ad spend work harder too
What a small change is worth here Lifting 2.32 out of 100 to 2.9 out of 100 is a change no shopper would ever notice. At your traffic and order size it adds about $1 million over three years. You would not spend a dollar more on ads to get it.
We didn't guess at any of this. We read 90 days of your Shopify reports, every one of your 88 live ads, and we shopped your store on a phone the way your customers do.